
Data Interpretation: CAT Previous Year Questions
Q. 1 Instructions
There are six spherical balls, B1, B2, B3, B4, B5, and B6, and four circular hoops H1, H2, H3, and H4.
Each ball was tested on each hoop once, by attempting to pass the ball through the hoop. If the diameter of a ball is not larger than the diameter of the hoop, the ball passes through the hoop and makes a “ping”. Any ball having a diameter larger than that of the hoop gets stuck on that hoop and does not make a ping.
The following additional information is known:
1. B1 and B6 each made a ping on H4, but B5 did not.
2. B4 made a ping on H3, but B1 did not.
3. All balls, except B3, made pings on H1.
4. None of the balls, except B2, made a ping on H2.
What was the total number of pings made by B1, B2, and B3?
Check Solution
Ans: 6
Let’s order the hoops and spheres by their diameter based on the provided details.
From the first piece of information, we learn that spheres B1 and B6 triggered a response from hoop H4, while sphere B5 did not. This allows us to conclude:
(B1, B6) < H4 < B5 --(1)
The second piece of information states that sphere B4 triggered a response from hoop H3, but sphere B1 did not. Therefore, we can establish:
B4 < H3 < B1 --(2)
According to the third piece of information, all spheres, with the exception of B3, triggered a response from hoop H1. This implies:
(B1, B2, B4, B5, B6) < H1 < B3 --(3)
The fourth piece of information tells us that only sphere B2 triggered a response from hoop H2, with no other spheres doing so. Consequently:
B2 < H2 < (B1, B3, B4, B5, B6) --(4)
By combining information (1) and (2), we can definitively arrange them as:
B4 < H3 < B1 < H4 < B5 --(5)
The position of sphere B6 remains uncertain; it could be smaller than H3 or larger than H3 but smaller than H4.
Integrating information (3), (4), and (5) yields the following arrangement:
B2 < H2 < B4 < H3 < B1 < H4 < B5 < H1 < B3
Sphere B6 can occupy two potential positions, resulting in two possible sequences:
Sequence A: B2 < H2 < (B4, B6) < H3 < B1 < H4 < B5 < H1 < B3
Sequence B: B2 < H2 < B4 < H3 < (B1, B6) < H4 < B5 < H1 < B3
Except for the exact placement of B6, the order of all other items is determined.
Now, let’s count the number of successful interactions (pings) for specific spheres:
Interactions by B1 = H4, H1 (Total: 2)
Interactions by B2 = H2, H3, H4, H1 (Total: 4)
Interactions by B3 = None (Total: 0)
The total count of interactions by spheres B1, B2, and B3 is the sum of their individual interactions: 2 + 4 + 0 = 6.
Therefore, the final answer is 6.
Q. 2 Which of the following statements about the relative sizes of the balls is NOT NECESSARILY true?
Check Solution
Ans: C
Let’s arrange the hoops and spheres by increasing diameter based on the provided details.
From the first piece of information, we learn that B1 and B6 triggered a signal at H4, while B5 did not. This allows us to establish:
(B1, B6) < H4 < B5 --(1)
The second detail states that B4 triggered a signal at H3, but B1 did not. Therefore, we can conclude:
B4 < H3 < B1 --(2)
According to the third piece of information, all balls except B3 triggered signals at H1. This leads to the conclusion:
(B1, B2, B4, B5, B6) < H1 < B3 --(3)
The fourth detail indicates that only B2 triggered a signal at H2, with no other balls doing so. This gives us:
B2 < H2 < (B1, B3, B4, B5, B6) --(4)
By combining insights (1) and (2), we can definitively state:
B4 < H3 < B1 < H4 < B5 --(5)
The exact placement of B6 remains uncertain; it could be smaller than H3 or larger than H3 but smaller than H4.
When we integrate (3), (4), and (5), we arrive at:
B2 < H2 < B4 < H3 < B1 < H4 < B5 < H1 < B3
There are two potential arrangements for B6, resulting in these two possible orderings:
B2 < H2 < (B4, B6) < H3 < B1 < H4 < B5 < H1 < B3
B2 < H2 < B4 < H3 < (B1,B6) < H4 < B5 < H1 < B3
The position of B6 is not fully determined, but all other positions are fixed.
Let’s evaluate the options:
Option A) B4 < B5 < B3. This statement is always true.
Option B) B2 < B1 < B5. This statement is always true.
Option C) B1 < B6 < B3. This statement is not necessarily true, as the relative diameters of B1 and B6 are unknown.
Option D) B1 < B5 < B3. This statement is always true.
Therefore, the correct answer is option C.
Q. 3 Which of the following statements about the relative sizes of the hoops is true?
Check Solution
Ans: A
Let’s arrange the hoops and spheres in ascending order of their diameter based on the provided details.
From the first piece of information, we know that B1 and B6 registered on H4, while B5 did not. This establishes that:
(B1, B6) < H4 < B5 --(1)
The second piece of information tells us B4 registered on H3, but B1 did not. This means:
B4 < H3 < B1 --(2)
The third piece of information states that all spheres, except B3, registered on H1. Therefore:
(B1, B2, B4, B5, B6) < H1 < B3 --(3)
The fourth piece of information indicates that only B2 registered on H2. This implies:
B2 < H2 < (B1, B3, B4, B5, B6) --(4)
By merging information (1) and (2), we can confidently deduce:
B4 < H3 < B1 < H4 < B5 --(5)
The only sphere whose position relative to H3 is not fully determined is B6. It could be smaller than H3 or larger than H3 but smaller than H4.
Combining details (3), (4), and (5) leads to:
B2 < H2 < B4 < H3 < B1 < H4 < B5 < H1 < B3
Sphere B6 can occupy two possible positions, resulting in two potential orderings:
B2 < H2 < (B4, B6) < H3 < B1 < H4 < B5 < H1 < B3
B2 < H2 < B4 < H3 < (B1, B6) < H4 < B5 < H1 < B3
The precise placement of B6 remains uncertain, but the positions of all other items are fixed.
We have determined the definitive order of hoop diameters as H2 < H3 < H4 < H1.
Therefore, the correct selection is option A.
Q. 4 What BEST can be said about the total number of pings from all the tests undertaken?
Check Solution
Ans: A
Let’s establish an ordering of the hoops and spheres based on their diameters, using the provided details.
From the first piece of information, we learn that both B1 and B6 triggered a signal at H4, whereas B5 did not. This leads to the deduction:
(B1, B6) < H4 < B5 --(1)
The second detail states that B4 triggered a signal at H3, but B1 did not. Therefore, we can conclude:
B4 < H3 < B1 --(2)
The third piece of information indicates that all balls, with the exception of B3, triggered signals at H1. This means:
(B1, B2, B4, B5, B6) < H1 < B3 --(3)
According to the fourth detail, only B2 triggered a signal at H2; none of the other balls did. This implies:
B2 < H2 < (B1, B3, B4, B5, B6) --(4)
Combining the insights from (1) and (2) allows us to establish:
B4 < H3 < B1 < H4 < B5 --(5)
At this point, the exact placement of B6 is uncertain. It could be smaller than H3, or it could be larger than H3 but still smaller than H4.
Now, integrating (3), (4), and (5), we arrive at a primary ordering:
B2 < H2 < B4 < H3 < B1 < H4 < B5 < H1 < B3
Considering the ambiguity with B6, there are two possible positions, leading to two potential overall orderings:
Scenario 1:
B2 < H2 < (B4, B6) < H3 < B1 < H4 < B5 < H1 < B3
In this scenario, the possible number of signals is: B2 (4), B4 (3), B6 (3), B1 (2), B5 (1), and B3 (0). The total count is 4 + 3 + 3 + 2 + 1 = 13.
Scenario 2:
B2 < H2 < B4 < H3 < (B1, B6) < H4 < B5 < H1 < B3
In this scenario, the possible number of signals is: B2 (4), B4 (3), B6 (2), B1 (2), B5 (1), and B3 (0). The total count is 4 + 3 + 2 + 2 + 1 = 12.
Therefore, the total number of possible signals is either 12 or 13.
This leads to the conclusion that the correct option is A.
Q. 5 Instructions
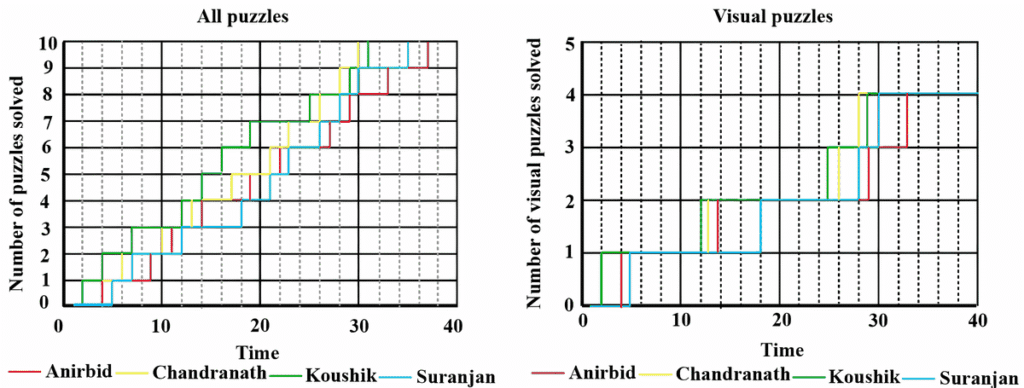
Anirbid, Chandranath, Koushik, and Suranjan participated in a puzzle solving competition. The competition comprised 10 puzzles that had to be solved in the same sequence, i.e., a competitor got access to a puzzle as soon as they solved the previous puzzle. Some of the puzzles were visual puzzles and the others were number-based puzzles. The winner of the competition was the one who solved all puzzles in the least time.
The following charts describe their progress in the competition. The chart on the left shows the number of puzzles solved by each competitor at a given time (in minutes) after the start of the competition. The chart on the right shows the number of visual puzzles solved by each competitor at a given time (in minutes) after the start of the competition.
Who had solved the largest number of puzzles by the 20-th minute from the start of the competition?
Check Solution
Ans: B
The plot on the left depicts a step function for each participant, where the vertical value at any given time ‘t’ represents the cumulative number of puzzles successfully solved by that participant up to minute ‘t’.
To determine the participant who completed the most puzzles by the 20th minute, draw a vertical line at the 20-minute mark on the horizontal axis (or observe the height of each participant’s colored step graph at the x=20 line).
Examining the four graphs at the t=20 point:
* Koushik’s graph (green) reaches the highest vertical position at t=20.
* Chandranath’s (yellow) and Anirbid’s (red) graphs are at lower levels compared to Koushik’s at this time.
* Suranjan’s graph (blue) is at the lowest vertical level among the four at t=20.
As Koushik’s completed puzzle count surpasses that of all other participants at t=20, Koushik has solved the maximum number of puzzles by the 20th minute.
Therefore, the correct option is B.
Q. 6 How many minutes did Suranjan take to solve the third visual puzzle in the competition?
Check Solution
Ans: 2
By examining the first and second charts, we can deduce the nature of the challenges.
The second chart indicates there are a total of 4 visually-oriented challenges, which implies there are 6 numerically-based challenges.
Let’s trace the green line across both charts:
According to the second chart, Green finished the first visually-oriented challenge in 2 minutes. Looking at the first chart at the 2-minute mark, Green solved challenge number 1. Therefore, challenge 1 is a visually-oriented one.
The second visually-oriented challenge was completed by Green in 12 minutes, as seen in the second chart. In the first chart, at the 12-minute mark, Green solved challenge number 4. Thus, challenge 4 is a visually-oriented challenge.
Green completed the third visually-oriented challenge in 25 minutes, as indicated by the second chart. Consulting the first chart at the 25-minute mark, Green solved challenge number 8. Consequently, challenge 8 is a visually-oriented challenge.
The fourth visually-oriented challenge was finished by Green in 29 minutes, according to the second chart. In the first chart, at the 29-minute mark, Green solved challenge number 9. Hence, challenge 9 is a visually-oriented challenge.
We can therefore conclude that challenges 1, 4, 8, and 9 are visually-oriented, while challenges 2, 3, 5, 6, 7, and 10 are numerically-based.
The third visually-oriented challenge is number 8. The duration taken by Suranjan (represented by the blue line) to complete this, the 8th challenge, can be determined as follows:
Time taken by Suranjan to solve the 8th challenge (from the first chart) = 28 minutes – 26 minutes = 2 minutes.
Therefore, the answer is 2.
Q. 7 At what number in the sequence was the fourth number-based puzzle?
Check Solution
Ans: 6
By examining the first and second charts, we can deduce the nature of the puzzles.
The second chart indicates a total of 4 puzzles requiring visual interpretation, leaving 6 puzzles that are number-based.
Let’s trace the green progression in both charts:
According to the second chart, Green finished the first visually-oriented puzzle in 2 minutes. In the first chart, at the 2-minute mark, Green completed puzzle 1. This suggests that puzzle 1 is a visual-based puzzle.
Green completed the second visually-oriented puzzle in 12 minutes, as shown in the second chart. The first chart reveals that at the 12-minute mark, Green solved puzzle 4. Therefore, puzzle 4 is a visual-based puzzle.
Green finished the third visually-oriented puzzle in 25 minutes, according to the second chart. Referring to the first chart at the 25-minute mark, Green solved puzzle 8. This implies that puzzle 8 is a visual-based puzzle.
Green concluded the fourth visually-oriented puzzle in 29 minutes, as indicated by the second chart. In the first chart, at the 29-minute mark, Green solved puzzle 9. Thus, puzzle 9 is a visual-based puzzle.
We can therefore classify puzzles 1, 4, 8, and 9 as visual-based, and puzzles 2, 3, 5, 6, 7, and 10 as number-based.
The fourth puzzle of the number-based category is the 6th puzzle in the sequence.
Consequently, the accurate answer is 6.
Q. 8 Which of the following is the closest to the average time taken by Anirbid to solve the number-based puzzles in the competition?
Check Solution
Ans: D
By examining the provided charts, we can ascertain the nature of the puzzles.
The second chart indicates a total of 4 puzzles of a visual nature, leaving 6 puzzles that are number-based.
Let’s trace the progress of the green line across both charts:
The first visual puzzle was finished by Green at the 2-minute mark, according to the second chart. Consulting the first chart at the 2-minute point reveals that Puzzle 1 was completed by Green. Therefore, Puzzle 1 can be identified as a visual-based puzzle.
The second visual puzzle was concluded by Green at the 12-minute mark, as shown in the second chart. Observing the first chart at the 12-minute mark, we see that Puzzle 4 was solved by Green. This suggests Puzzle 4 is a visual-based puzzle.
The third visual puzzle was finished by Green at the 25-minute mark, according to the second chart. In the first chart, at the 25-minute point, Puzzle 8 was solved by Green. Hence, Puzzle 8 can be classified as a visual-based puzzle.
The fourth visual puzzle was completed by Green at the 29-minute mark, as indicated by the second chart. Referring to the first chart at the 29-minute mark, we find that Puzzle 9 was solved by Green. Thus, Puzzle 9 is also a visual-based puzzle.
We can deduce that puzzles 1, 4, 8, and 9 are categorized as visual-based. Conversely, puzzles 2, 3, 5, 6, 7, and 10 are identified as number-based.
To calculate the average duration Anirbid spent on the number-based puzzles:
Duration for the first number-based puzzle (Puzzle 2) from the first chart = 9 minutes – 4 minutes = 5 minutes.
Duration for the second number-based puzzle (Puzzle 3) from the first chart = 11 minutes – 9 minutes = 2 minutes.
Duration for the third number-based puzzle (Puzzle 5) from the first chart = 19 minutes – 14 minutes = 5 minutes.
Duration for the fourth number-based puzzle (Puzzle 6) from the first chart = 22 minutes – 19 minutes = 3 minutes.
Duration for the fifth number-based puzzle (Puzzle 7) from the first chart = 27 minutes – 22 minutes = 5 minutes.
Duration for the sixth number-based puzzle (Puzzle 10) from the first chart = 37 minutes – 33 minutes = 4 minutes.
Average $=\ \dfrac{5\ +\ 2\ +\ 5\ +\ 3\ +\ 5\ +\ 4}{6}\ =\ \dfrac{24}{6}\ =\ 4$ minutes.
The average time Anirbid invested in solving the number-based puzzles is 4 minutes.
Therefore, the correct selection is option D.
Q. 9 Instructions
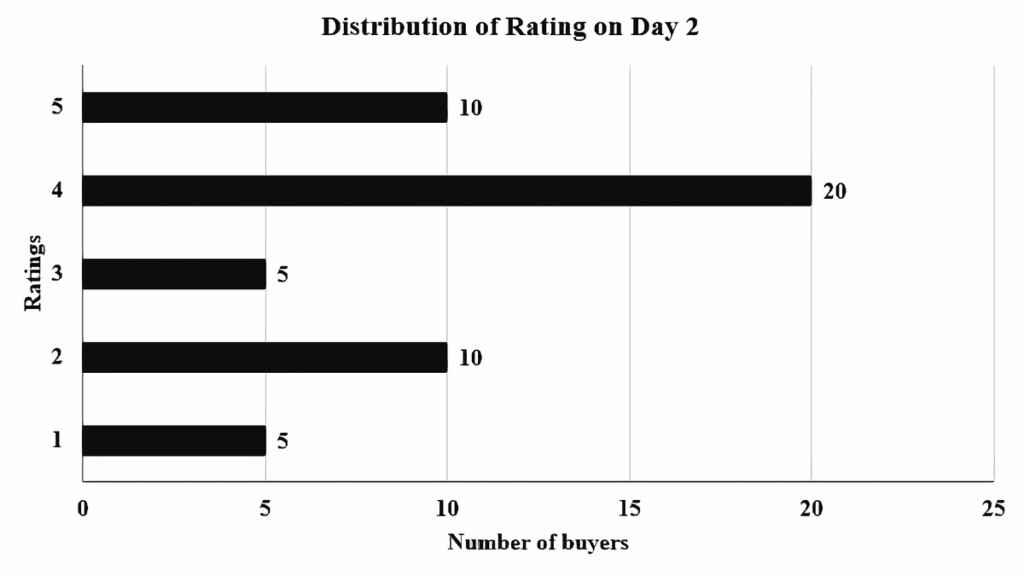
An online e-commerce firm receives daily integer product ratings from 1 through 5 given by buyers. The daily average is the average of the ratings given on that day. The cumulative average is the average of all ratings given on or before that day. The rating system began on Day 1, and the cumulative averages were 3 and 3.1 at the end of Day 1 and Day 2, respectively. The distribution of ratings on Day 2 is given in the figure below.
The following information is known about ratings on Day 3.
1. 100 buyers gave product ratings on Day 3.
2. The modes of the product ratings were 4 and 5.
3. The numbers of buyers giving each product rating are non-zero multiples of 10.
4. The same number of buyers gave product ratings of 1 and 2, and that number is half the number of buyers who gave a rating of 3.
How many buyers gave ratings on Day 1?
Check Solution
Ans: 150
Based on the provided chart, the average rating on day 2 can be calculated as follows:
$\frac{\left(5\times\ 1\right)+\left(10\times\ 2\right)+\left(5\times\ 3\right)+\left(20\times\ 4\right)+\left(10\times\ 5\right)}{5+10+5+20+10}=\frac{170}{50}=3.4$
We are informed that the combined average rating for day 1 and day 2 is 3.1, and the average rating for day 1 alone was 3.
Let’s denote the quantity of ratings received on day 1 as $x$. Using the overall average for both days and the average for day 2, we can establish the following equation:
$\frac{3x+\left(50\times\ 3.4\right)}{x+50}=3.1$
Multiplying both sides by $x+50$ yields:
$3x+170=3.1(x+50)$
$3x+170=3.1x+155$
Rearranging the terms to solve for $x$:
$170 – 155 = 3.1x – 3x$
$15\ =\ 0.1x$
Dividing by 0.1 gives:
$x=150$
Thus, the count of ratings received on day 1 was 150.
Q. 10 What is the daily average rating of Day 3?
Check Solution
Ans: A
On the third day, a total of 100 ratings were recorded.
The most frequent ratings (modes) were 4 and 5, indicating an equal quantity of these ratings. Since all ratings were stated to be non-zero multiples of 10, let this quantity be represented as $10b$.
Let’s assign the count of 1 and 2 ratings as $10a$ for each, and consequently, the count of 3 ratings would be $20a$.
Summing up all the ratings: $10a + 10a + 20a + 10b + 10b = 100$
This simplifies to: $40a + 20b = 100$
Dividing by 20, we get: $2a + b = 5$
The possible integer solutions for $a$ and $b$, where neither is zero, are:
1. $a = 1$ and $b = 3$
2. $a = 2$ and $b = 1$
However, if $b=1$, then the number of 4 and 5 ratings would be 10 each, while the number of 3 ratings would be 20. This would make 3 the sole mode rating, contradicting the given information that both 4 and 5 were modes. Therefore, we must discard the second case ($a=2, b=1$).
This leaves us with the counts:
– 1 rating: $10 \times 1 = 10$
– 2 ratings: $10 \times 1 = 10$
– 3 ratings: $20 \times 1 = 20$
– 4 ratings: $10 \times 3 = 30$
– 5 ratings: $10 \times 3 = 30$
The average rating is calculated as:
$ \frac{(10 \times 1) + (10 \times 2) + (20 \times 3) + (30 \times 4) + (30 \times 5)}{100} $
$ = \frac{10 + 20 + 60 + 120 + 150}{100} $
$ = \frac{360}{100} = 3.6 $
Thus, Option A is the correct selection.
Q. 11 Which of the following is true about the cumulative average ratings of Day 2 and Day 3?
Check Solution
Ans: C
The aggregate rating by the close of day 3 can be computed as:
$\frac{\left(\text{Day 2 aggregate rating} \times \text{Day 2 rating count}\right)+\left(\text{Day 3 rating} \times \text{Day 3 count}\right)}{\text{Total rating count}}$
[Day 2 aggregate rating = 3.1
Number of ratings by day 2 = 200]
$\frac{\left(3.1\times\ 200\right)+\left(3.6\times\ 100\right)}{200+100} = \frac{360+620}{300} = \frac{980}{300} \approx 3.266$
The percentage change in the aggregate rating from day 2 to day 3 is found by:
$\frac{\text{New aggregate rating} – \text{Old aggregate rating}}{\text{Old aggregate rating}} \times 100$
$\frac{3.266-3.1}{3.1}\times\ 100\approx\ 5.34\%$
This result is consistent with the information presented in choice C.
Consequently, choice C is the accurate selection.
Q. 12 Instructions
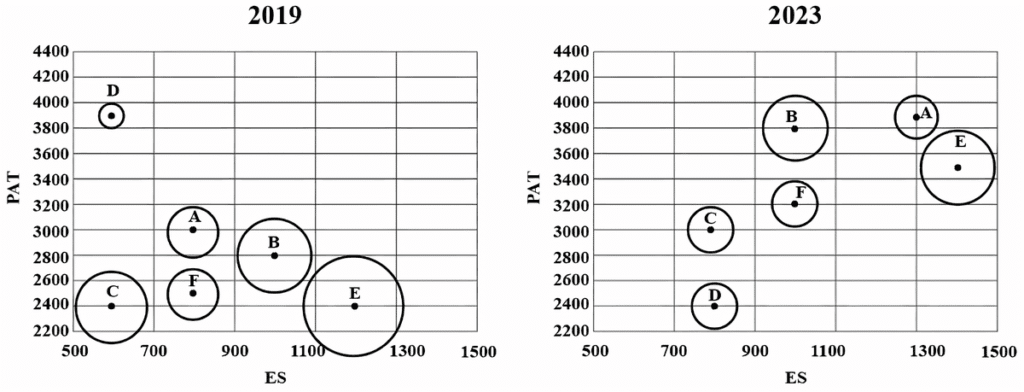
The two plots below give the following information about six firms A, B, C, D, E, and F for 2019 and 2023.
PAT: The firm’s profits after taxes in Rs. crores,
ES: The firm’s employee strength, that is the number of employees in the firm, and
PRD: The percentage of the firm’s PAT that they spend on Research and Development (R&D).
In the plots, the horizontal and vertical coordinates of point representing each firm gives their ES and PAT values respectively. The PRD values of each firm are proportional to the areas around the points representing each firm. The areas are comparable between the two plots, i.e., equal areas in the two plots represent the same PRD values for the two years.
Assume that the annual rate of growth in PAT over the previous year (ARG) remained constant over the years for each of the six firms. Which among the firms A, B, C, and E had the highest ARG?
Check Solution
Ans: C
Given the assumption of a consistent annual expansion rate, we can determine the firms with the highest Average Growth Rate (ARG) by examining the percentage change in their Profit After Tax (PAT) between 2019 and 2023.
Firm A: PAT increased from 3000 to 3900. The absolute increase is 900. The growth rate is calculated as $\frac{900}{3000} = \frac{3}{10} = 0.3$.
Firm C: PAT increased from 2400 to 3000. The absolute increase is 600. The growth rate is calculated as $\frac{600}{2400} = \frac{1}{4} = 0.25$.
Firm E: PAT increased from 2400 to 3500. The absolute increase is 1100. The growth rate is calculated as $\frac{1100}{2400} = \frac{11}{24} \approx 0.45$.
Firm B: PAT increased from 2800 to 3800. The absolute increase is 1000. The growth rate is calculated as $\frac{1000}{2800} = \frac{5}{14} \approx 0.35$.
Comparing these calculated growth rates, Firm E exhibits the highest expansion rate, approaching 0.5. Consequently, Firm E is expected to have the highest ARG among the presented choices.
Therefore, the correct selection is Option C.
Q. 13 The ratio of the amount of money spent by Firm C on R&D in 2019 to that in 2023 is closest to
Check Solution
Ans: D
This question can be somewhat challenging because the bubbles aren’t confined by strict boundaries, but in such situations, we should estimate based on the most apparent representations.
For example, the bubble representing C in 2019 appears to have a vertical diameter of approximately 3 units, whereas the one in 2023 has a diameter of about 2 units.
The proportion of expenditure on R&D in 2019 compared to 2024 can be calculated as follows:
$\frac{2400\pi\left(1.5\right)^2\ }{3000\pi\ \left(1\right)^2}=\frac{8}{10}\times\ \frac{9}{4}=9:5$
This corresponds to option D.
Q. 14 Which among the firms A, C, E, and F had the maximum PAT per employee in 2023?
Check Solution
Ans: D
The profit generated per worker for each company in the year 2023 is calculated as follows:
For Company E:
$\frac{3500}{1400} = \frac{35}{14} = \frac{5}{2}$
For Company A:
$\frac{3900}{1300} = 3$
For Company F:
$\frac{3200}{1000} = 3.2$
For Company C:
$\frac{3000}{800} = \frac{15}{4} = 3.75$
The highest profit per worker is observed for Company C. Consequently, Option D represents the correct selection.
Q. 15 Which among the firms C, D, E, and F had the least amount of R&D spending per employee in 2023?
Check Solution
Ans: B
Having previously determined the Profit After Tax (PAT) per employee for firms F, C, and E, we now compute this metric for firm D: $\frac{2400}{800}=3$.
For firms F, C, and D, the represented area is consistent, meaning PAT per employee is the sole determinant. The values are: F at 3.2, C at 3.75, and D at 3. Based on this, D exhibits the lowest PAT per employee among these three.
Now, let’s compare E and D, introducing a proportionality constant ‘k’.
Firm E has a PAT per employee of 2.5 and a radius of 1.5 units. Its R&D expenditure per employee would be calculated as $\frac{5}{2}k\pi\ \left(\frac{3}{2}\right)^2=k\pi\ \times\ \frac{5\times\ 9}{8}$.
Firm D has a PAT per employee of 3 and a radius of 1 unit. Its R&D expenditure per employee would be $\qquad 3k\pi\ \left(1\right)^2=3k\pi\ $.
It is evident that firm E’s R&D expenditure per employee will be higher. Consequently, firm D demonstrates the lowest R&D spending per employee in 2023.
Thus, Option B represents the correct choice.
Q. 16 Instructions
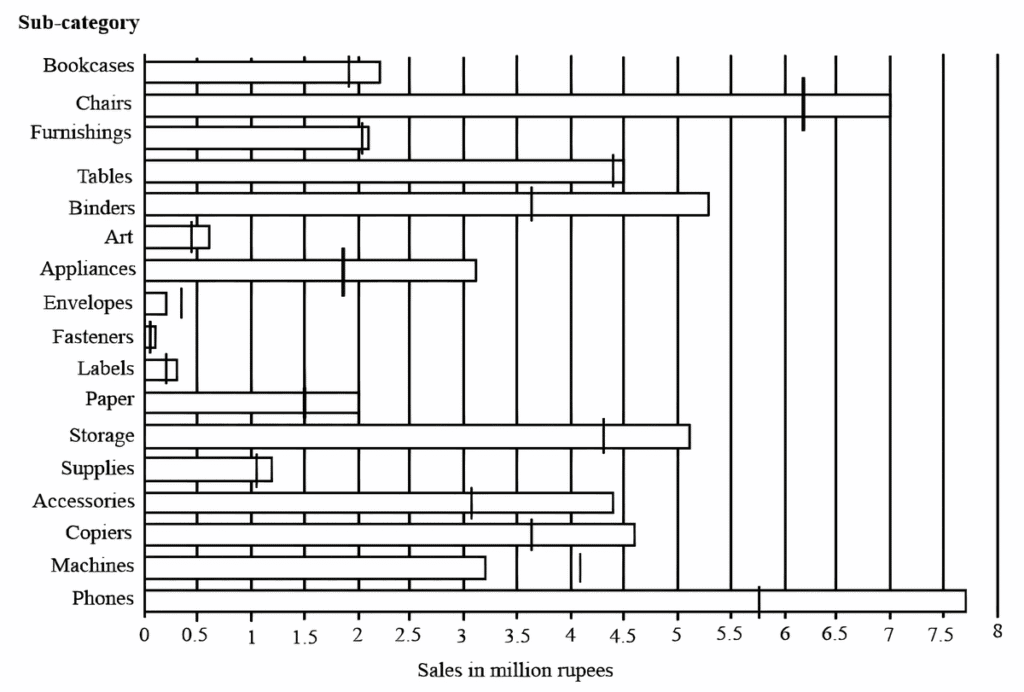
The horizontal bars in the above diagram represent 2020 aggregate sales (in ₹ million) of a company for the different subcategories of its products. The top four product subcategories (Bookcases, Chairs, Furnishings, Tables) belong to furniture product category; the bottom four product subcategories (Accessories, Copiers, Machines, Phones) belong to the technology product category while all other product subcategories belong to the office supply product category. For each of the product subcategories, there is a vertical line indicating the sales of the corresponding subcategory in 2019.
The total sales (in ₹ million) in 2019 from products in office supplies category is closest to
Check Solution
Ans: C
The aggregate revenue generated by office supply items during 2019 amounts to:
The combined revenue from:
Binders: 3.6 million
Art Supplies: 0.4 million
Appliances: 1.9 million
Envelopes: 0.3 million
Fasteners: 0.1 million
Labels: 0.2 million
Paper Goods: 1.5 million
Storage Solutions: 4.3 million
General Supplies: 1.1 million
The total revenue from these items is calculated as 3.6 + 0.4 + 1.9 + 0.3 + 0.1 + 0.2 + 1.5 + 4.3 + 1.1 = 13.4 million.
The option closest to this calculated total is 13.5 million.
Q. 17 The percentage increase in sales in Furniture category from 2019 to 2020 is closest to
Check Solution
Ans: B
Here’s how to determine the overall percentage growth in furniture sales between 2019 and 2020:
We are provided with the following sales figures (in millions):
* **Bookcases:** 1.9 (2019) and 2.2 (2020)
* **Chairs:** 6.2 (2019) and 7 (2020)
* **Furnishings:** 2.05 (2019) and 2.1 (2020)
* **Tables:** 4.4 (2019) and 4.5 (2020)
To calculate the overall percentage increase, we first need to find the total sales for each year.
Total sales in 2019 = 1.9 + 6.2 + 2.05 + 4.4 = 14.55 million
Total sales in 2020 = 2.2 + 7 + 2.1 + 4.5 = 15.8 million
The formula for percentage increase is:
$\text{Percentage Increase} = \frac{(\text{New Value} – \text{Original Value})}{\text{Original Value}} \times 100$
Applying this to our total sales figures:
$\frac{\left(15.8 – 14.55\right)}{14.55} \times 100$
$\frac{1.25}{14.55} \times 100 \approx 8.53\%$
Therefore, the percentage increase in sales for the furniture category from 2019 to 2020 is approximately 8.53%.
Q. 18 How many subcategories had sales of ₹ 4 million or more in 2019 and registered an increase in sales in excess of 25% in 2020?
Check Solution
Ans: 1
The quantity of product segments that achieved revenues of ₹ 4 million or greater in the year 2019 and experienced a sales growth exceeding 25% in 2020:
The product segments with revenue exceeding 4 million in 2019 are as follows:
Chairs: ₹ 6.2 million in 2019 and ₹ 7 million in 2020. (A 25 percent rise would necessitate sales of at least ₹ 7.8 million, therefore this segment does not qualify)
Tables: ₹ 4.4 million in 2019 and ₹ 4.5 million in 2020. (To achieve a 25 percent increase, sales needed to be at least ₹ 5.5 million, so this segment does not qualify)
Storage: ₹ 4.3 million in sales in 2019 and ₹ 5.1 million in 2020. (A 25 percent rise would require sales of at least ₹ 5.4 million, thus failing this condition)
Phones: ₹ 5.75 million in 2019 and ₹ 7.5 million in 2020. (This represents a growth of 30.5 percent)
Consequently, only one product segment meets the specified criteria.
Q. 19 The improvement index for a category is the maximum percentage increase in sales from 2019 to 2020 among any of its subcategories. The correct order of categories in increasing order of this improvement index is
Check Solution
Ans: A
The “improvement index” for a specific product group is defined as the largest percentage growth in sales observed between 2019 and 2020 within any of its constituent sub-groups.
Therefore, to determine this index, we must examine the provided sales figures and identify the subcategories that experienced the most significant sales escalation from 2019 to 2020.
Analyzing the provided data:
For the **Furniture** category:
* **Bookcases** show a notable percentage rise, moving from 1.9 million to 2.2 million (a 15.7% increase).
* **Chairs** also demonstrate a substantial increase, growing from 6.2 million to 7 million (a 12.9% increase).
For the **Office Supply** category:
* **Binders** exhibit a considerable percentage increase, escalating from 3.6 million to 5.3 million (a 47% increase).
* **Appliances** display an even more pronounced surge, jumping from 1.9 million to 3.15 million (a 65.7% increase).
For the **Technology Product** category:
* **Accessories** experienced a significant rise, from 3.1 million to 4.4 million (a 41.9% increase).
* **Phones** also saw a strong upward trend, increasing from 5.8 million to 7.7 million (a 32.7% increase).
Consequently, when comparing the highest increases across these categories:
The order of increasing growth from highest to lowest is:
Furniture < Technology Product < Office Supply.
Q. 20 Instructions
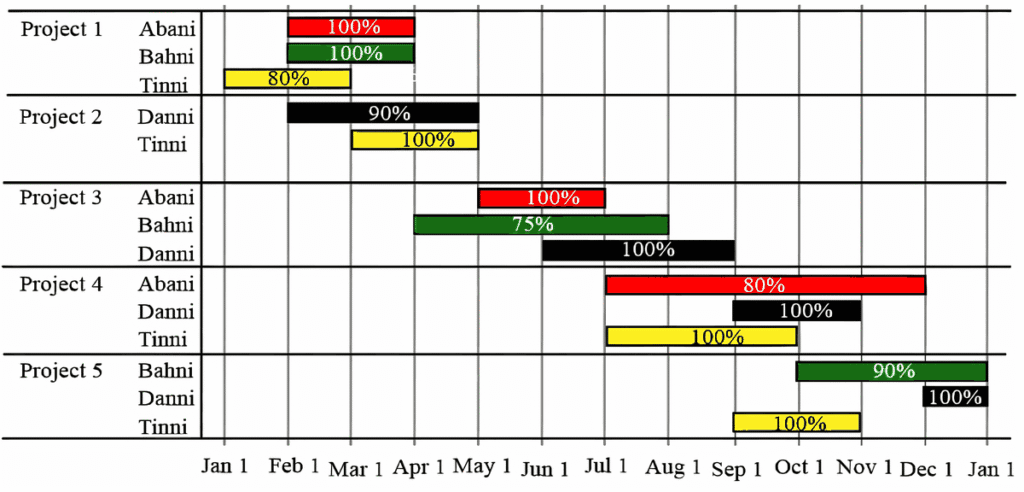
The figure above shows the schedule of four employees – Abani, Bahni, Danni, and Tinni – whom Dhoni supervised in 2020. Altogether there were five projects which started and concluded in 2020 in which they were involved. For each of these projects and for each employee, the starting day was at the beginning of a month and the concluding day was the end of a month, and these are indicated by the left and right end points of the corresponding horizontal bars. The number within each bar indicates the percentage of assigned work completed by the employee for that project, as assessed by Dhoni.
For each employee, his/her total project-month (in 2020) is the sum of the number of months (s)he worked across the five projects, while his/her annual completion index is the weightage average of the completion percentage assigned from the different projects, with the weights being the corresponding number of months (s)he worked in these projects. For each project, the total employee-month is the sum of the number of months four employees worked in this project, while its completion index is the weightage average of the completion percentage assigned for the employees who worked in this project, with the weights being the corresponding number of months they worked in this project.
Which of the following statements is/are true?
I: The total project-month was the same for the four employees.
II: The total employee-month was the same for the five projects.
Check Solution
Ans: D
The aggregate project duration represents the cumulative months each of the four individuals – Abani, Bahni, Danni, and Tinni – dedicated across all undertakings:
* Abani’s contributions: 2 + 2 + 5 = 9 months
* Bahni’s contributions: 2 + 4 + 3 = 9 months
* Danni’s contributions: 3 + 3 + 2 + 1 = 9 months
* Tinni’s contributions: 2 + 2 + 3 + 2 = 9 months
The overall workforce tenure for all five projects is derived by summing the individual monthly efforts of the four personnel on these projects.
* Undertaking 1: 2 + 2 + 2 = 6 months
* Undertaking 2: 3 + 2 = 5 months
* Undertaking 3: 2 + 4 + 3 = 9 months
* Undertaking 4: 5 + 2 + 3 = 10 months
* Undertaking 5: 3 + 1 + 2 = 6 months
Only the initial assertion is factually correct.
Q. 21 Which employees did not work in multiple projects for any of the months in 2020?
Check Solution
Ans: A
In a given month, Abani, Banni, and Danni each worked on no more than one project.
Tinni was the sole individual engaged in more than one project during September, specifically working on projects numbered 4 and 5.
Q. 22 The project duration, measured in terms of the number of months, is the time during which at least one employee worked in the project. Which of the following pairs of the projects had the same duration?
Check Solution
Ans: D
Based on the provided data:
Project Alpha: Duration of 3 months.
Project Beta: Duration of 3 months.
Project Gamma: Duration of 5 months.
Project Delta: Duration of 5 months.
Project Epsilon: Duration of 4 months.
From the presented choices, option D is accurate, consisting of Project Gamma and Project Delta.
Q. 23 Instructions
In a certain board examination, students were to appear for examination in five subjects:
English, Hindi, Mathematics, Science and Social Science. Due to a certain emergency situation, a few of the examinations could not be conducted for some students. Hence, some students missed one examination and some others missed two examinations. Nobody missed more than two examinations.
The board adopted the following policy for awarding marks to students. If a student appeared in all five examinations, then the marks awarded in each of the examinations were on the basis of the scores obtained by them in those examinations.
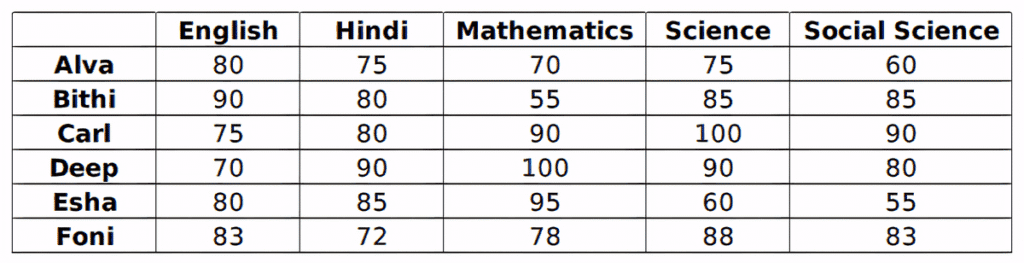
If a student missed only one examination, then the marks awarded in that examination was the average of the best three among the four scores in the examinations they appeared for. If a student missed two examinations, then the marks awarded in each of these examinations was the average of the best two among the three scores in the examinations they appeared for. The marks obtained by six students in the examination are given in the table below. Each of them missed either one or two examinations.
The following facts are also known.
I. Four of these students appeared in each of the English, Hindi, Science, and Social Science examinations.
II. The student who missed the Mathematics examination did not miss any other examination.
III. One of the students who missed the Hindi examination did not miss any other examination. The other student who missed the Hindi examination also missed the Science examination.
Who among the following did not appear for the Mathematics examination?
Check Solution
Ans: B
According to Condition II, the individual who did not take the Mathematics exam also did not miss any other exam. This implies that their Mathematics score must be the average of their best three scores from the other four examinations. We can use this information to pinpoint the Mathematics score by calculating the average of the remaining scores for each candidate. Candidates Deep and Esha can be immediately ruled out because their Mathematics scores are higher than their other exam scores, which contradicts the condition.
Let’s examine the remaining candidates:
For Alva:
The best three scores from the other four exams are 80 (English), 75 (Hindi), and 75 (Science).
The average is (80 + 75 + 75) / 3 = 230 / 3 = 76.67. This is not equal to Alva’s reported Mathematics score of 70.
For Carl:
The best three scores from the other four exams are 80 (Hindi), 90 (Social Science), and 100 (Science).
The average is (80 + 90 + 100) / 3 = 270 / 3 = 90. This matches Carl’s reported Mathematics score.
For Foni:
The best three scores from the other four exams are 83 (English), 83 (Social Science), and 88 (Science).
The average is (83 + 83 + 88) / 3 = 254 / 3 = 84.67. This is not equal to Foni’s reported Mathematics score of 78.
Based on this analysis, only Carl’s scores align with the condition that he missed his Mathematics examination. Therefore, Option B is the correct choice.
Q. 24 Which students did not appear for the English examination?
Check Solution
Ans: D
Leveraging the second condition, it’s understood that the student who did not appear for the Mathematics exam also did not miss any other exam. This implies their Mathematics score represents the average of their top 3 scores from the remaining 4 exams. We can immediately exclude Deep and Esha, as their Mathematics scores are higher than their other exam scores. Upon calculating the average scores for the remaining candidates, we find that Carl is the one who missed the Mathematics exam.
For Carl: The top 3 scores from 4 exams are 80 (Hindi), 90 (Social Science), and 100 (Science).
Average = 270 / 3 = 90, which aligns with the given information.
Therefore, Carl missed his Mathematics examination.
Moving to the third condition, it’s inferred that the student(s) who missed both Hindi and Science should have comparable average scores in these two subjects. Alva has identical scores of 75 in both Hindi and Science. Similarly, Deep scored 90 in both subjects. Consequently, one of them missed both Hindi and Science exams, while the other missed only the Hindi exam.
Given that Carl, Alva, and Deep are unlikely to have missed the English exam, our focus shifts to Bithi, Esha, and Foni for the English exam. However, Bithi’s English score exceeds her other scores, ruling her out as a candidate who missed English.
For Esha: The top 3 scores from 4 exams are 85 (Hindi), 95 (Mathematics), and 60 (Science).
Average = 240 / 3 = 80, which matches the given information.
Therefore, Esha most likely missed her English examination.
For Foni: The top 3 scores from 4 exams are 78 (Mathematics), 83 (Social Science), and 88 (Science).
Average = 249 / 3 = 83, which matches the given information.
Therefore, Foni most likely missed her English examination.
According to the first condition, precisely two students missed examinations in English, Hindi, Science, and Social Science. For English, these students are identified as Esha and Foni. For Hindi, they are Alva and Deep. For Science, one student is either Alva or Deep. Since Carl, Alva, and Deep cannot be part of the group that missed Science or Social Science exams, we will meticulously examine the remaining group: Bithi, Esha, and Foni.
We observe that Bithi has similar scores in both Science and Social Science examinations. Assuming she missed these exams, let’s verify this.
For Bithi: The top 2 scores from 3 exams are 90 (English) and 80 (Hindi).
Average = 170 / 2 = 85, which matches the given information.
Therefore, Bithi likely missed her Science and Social Science examinations.
Additionally, Foni has similar scores in English and Social Science. Considering the top 2 out of 3 scores, the average for both subjects remains consistent (equal to 83). Thus, it can be concluded that Bithi and Foni missed their Social Science examination.
The students who missed only one exam were: Carl (Mathematics); Esha (English), and one of Alva or Deep (Hindi).
Therefore, of the six students, the missed subjects for four of them can be accurately determined (excluding Alva and Deep):
Mathematics: Carl
English: Esha & Foni
Hindi: Alva & Deep
Science: Bithi & one of Alva and Deep
Social Science: Foni & Bithi
Hence, the correct response is Option D: Esha and Foni.
Q. 25 What BEST can be concluded about the students who did not appear for the Hindi examination?
Check Solution
Ans: B
From Condition II, it’s understood that the student who did not take the Mathematics exam also did not miss any other subject. This means their Mathematics score must be the average of their best three scores out of the four exams they did take. With this insight, we can identify the candidate whose Math score fits this description. We can immediately rule out Deep and Esha because their Mathematics scores are higher than their other scores. After calculating the average of the remaining scores for other candidates, we find that Carl is the one who missed the Mathematics exam.
For Carl: The best 3 out of 4 scores are 80 (Hindi), 90 (Social Science), and 100 (Science).
Average = (80 + 90 + 100) / 3 = 270 / 3 = 90. This matches Carl’s given score.
Therefore, Carl missed his Mathematics examination.
Moving to Condition III, it suggests that the student who missed both Hindi and Science examinations would have similar average scores in those two subjects. We observe that Alva has identical scores of 75 in both Hindi and Science. Similarly, Deep has a score of 90 in both these subjects. This implies that one of them missed Hindi and Science, while the other missed only Hindi.
Since Carl, Alva, and Deep are unlikely to have missed the English exam, we focus on Bithi, Esha, and Foni to determine who missed English. However, Bithi’s English score is higher than her other scores, making her an unlikely candidate for missing English.
For Esha: The best 3 out of 4 scores are 85 (Hindi), 95 (Mathematics), and 60 (Science).
Average = (85 + 95 + 60) / 3 = 240 / 3 = 80. This matches Esha’s given score.
Therefore, Esha most likely missed her English examination.
For Foni: The best 3 out of 4 scores are 78 (Mathematics), 83 (Social Science), and 88 (Science).
Average = (78 + 83 + 88) / 3 = 249 / 3 = 83. This matches Foni’s given score.
Therefore, Foni most likely missed her English examination.
Condition I states that exactly two students missed each of the English, Hindi, Science, and Social Science examinations. We’ve identified Esha and Foni as the two who missed English, and Alva and Deep as the two who missed Hindi. For Science, one of the individuals is either Alva or Deep. Given that Carl, Alva, and Deep did not miss the Science or Social Science exams, we re-examine Bithi, Esha, and Foni.
Bithi has similar scores in Science and Social Science. Assuming she missed these exams, let’s verify.
For Bithi: The best 2 out of 3 scores (excluding Science and Social Science) are 90 (English) and 80 (Hindi).
Average = (90 + 80) / 2 = 170 / 2 = 85. This matches Bithi’s given score.
Therefore, Bithi is likely to have missed her Science and Social Science examinations.
Additionally, Foni has similar scores in English and Social Science. Considering the best 2 out of 3 scores, the average matches her score (83). This confirms Bithi and Foni missed their Social Science examination.
In summary, the students who missed only one exam were: Carl (Mathematics); Esha (English); and one of Alva or Deep (Hindi).
Thus, for five of the six students, we can ascertain the missed subjects (excluding the ambiguity for Alva and Deep in Science):
Mathematics: Carl
English: Esha and Foni
Hindi: Alva and Deep
Science: Bithi and one of Alva or Deep
Social Science: Foni and Bithi
Based on this, the question likely asks who missed the Hindi examination.
The correct answer to this question is Option B: Alva and Deep.
Q. 26 What BEST can be concluded about the students who missed the Science examination?
Check Solution
Ans: A
Based on the second condition, the student who did not take the Mathematics exam also did not miss any other exams. This implies their Mathematics score is the average of their best three scores from the remaining four exams. Using this, we can identify the candidate whose Mathematics score fits this description. Deep and Esha can be immediately excluded as their Mathematics scores are higher than their other exam scores. Upon calculating the averages for the remaining candidates, it is found that Carl is the one who missed the Mathematics exam.
For Carl:
Best 3 out of 4 scores: 80 (Hindi), 90 (Social Science), 100 (Science)
Average = (80 + 90 + 100) / 3 = 270 / 3 = 90. This matches Carl’s given score.
Therefore, Carl missed his Mathematics examination.
According to the third condition, the student who missed both Hindi and Science examinations should have similar average scores in these two subjects. Alva has identical scores of 75 in both Hindi and Science. Deep also has identical scores of 90 in both these subjects. This suggests that one of them missed both Hindi and Science, while the other missed only Hindi.
As Carl, Alva, and Deep are unlikely to have missed the English exam, we focus on Bithi, Esha, and Foni for the English exam. Bithi’s English score is higher than her other scores, eliminating her as a candidate for missing the English exam.
For Esha:
Best 3 out of 4 scores: 85 (Hindi), 95 (Mathematics), 60 (Science)
Average = (85 + 95 + 60) / 3 = 240 / 3 = 80. This matches Esha’s given score.
Therefore, Esha most likely missed her English examination.
For Foni:
Best 3 out of 4 scores: 78 (Mathematics), 83 (Social Science), 88 (Science)
Average = (78 + 83 + 88) / 3 = 249 / 3 = 83. This matches Foni’s given score.
Therefore, Foni most likely missed her English examination.
The first condition states that exactly two candidates missed examinations for English, Hindi, Science, and Social Science.
For English, we identified Esha and Foni. For Hindi, we identified Alva and Deep. For Science, one of Alva or Deep missed the exam. Since Carl, Alva, and Deep did not miss the Science or Social Science exams, we examine Bithi, Esha, and Foni. Bithi has similar scores in Science and Social Science. If we assume she missed these exams, let’s verify.
For Bithi:
Best 2 out of 3 scores (assuming she missed Science and Social Science): 90 (English), 80 (Hindi)
Average = (90 + 80) / 2 = 170 / 2 = 85. This matches Bithi’s given score.
Therefore, Bithi is likely to have missed her Science and Social Science examinations.
Additionally, Foni has similar scores in English and Social Science. Considering the best 2 out of 3 scores, the average score for both subjects holds true (equal to 83). Thus, Bithi and Foni missed their Social Science examination.
The students who missed only one exam are: Carl (Mathematics); Esha (English); and one out of Alva and Deep (Hindi).
Of the six students, we can determine the missed subjects for four of them (excluding Alva and Deep):
Mathematics: Carl
English: Esha & Foni
Hindi: Alva & Deep
Science: Bithi & one out of Alva and Deep
Social Science: Foni & Bithi
Hence, the correct answer is: Bithi & one out of Alva and Deep.
Q. 27 How many out of these six students missed exactly one examination?
Check Solution
Ans: 3
Based on the provided information (Condition II), the student who did not take the Mathematics exam had their Mathematics score represented as the average of their best three scores out of the four examinations. This implies we should look for a candidate whose Mathematics score is the average of their other three scores. Candidates Deep and Esha can be excluded immediately because their Mathematics scores exceed their scores in other subjects. Upon calculating the averages for the remaining candidates, it is determined that Carl is the individual who missed the Mathematics examination.
For Carl: The best three scores out of four are 80 (Hindi), 90 (Social Science), and 100 (Science).
Average = (80 + 90 + 100) / 3 = 270 / 3 = 90. This matches Carl’s stated score.
Therefore, Carl missed his Mathematics examination.
According to Condition III, the student(s) who missed both Hindi and Science examinations should have similar average scores in these two subjects. Alva has identical scores of 75 in both Hindi and Science. Similarly, Deep scores 90 in both these subjects. This suggests that one of Alva or Deep missed both Hindi and Science, while the other missed only Hindi.
Given that Carl, Alva, and Deep are unlikely to have missed the English exam, we focus on Bithi, Esha, and Foni to identify who missed English. Bithi’s English score is higher than her other scores, ruling her out as a candidate for missing English.
For Esha: The best three scores out of four are 85 (Hindi), 95 (Mathematics), and 60 (Science).
Average = (85 + 95 + 60) / 3 = 240 / 3 = 80. This matches Esha’s stated score.
Therefore, Esha most likely missed her English examination.
For Foni: The best three scores out of four are 78 (Mathematics), 83 (Social Science), and 88 (Science).
Average = (78 + 83 + 88) / 3 = 249 / 3 = 83. This matches Foni’s stated score.
Therefore, Foni most likely missed her English examination.
Condition I states that precisely two candidates missed each of the examinations in English, Hindi, Science, and Social Science. For English, Esha and Foni are identified as those who missed it. For Hindi, Alva and Deep are the candidates. For Science, either Alva or Deep is the missing candidate. Since Carl, Alva, and Deep are not among those who missed Science or Social Science, we examine Bithi, Esha, and Foni.
Bithi has similar scores in Science and Social Science. If we assume she missed these exams, let’s verify.
For Bithi: The best two scores out of three are 90 (English) and 80 (Hindi).
Average = (90 + 80) / 2 = 170 / 2 = 85. This matches Bithi’s stated score.
Therefore, Bithi likely missed her Science and Social Science examinations.
Foni has similar scores in English and Social Science. Considering the best two out of three scores, her average score for both subjects matches her given score (83). Thus, Bithi and Foni missed their Social Science examination.
The students who missed only one exam are: Carl (Mathematics); Esha (English); and one of Alva or Deep (Hindi).
Of the six students, the missed subjects for four can be definitively determined (excluding the ambiguity between Alva and Deep for one subject):
Mathematics: Carl
English: Esha & Foni
Hindi: Alva & Deep
Science: Bithi & one of Alva or Deep
Social Science: Foni & Bithi
The correct answer to this question identifies: Carl (Mathematics); Esha (English); and one of Alva or Deep (Hindi).
Q. 28 For how many students can we be definite about which examinations they missed?
Check Solution
Ans: 4
From Condition II, it’s understood that the student who did not take the Mathematics exam also did not miss any other subject. This implies their Mathematics score is the average of their three best scores from the remaining four exams. We can identify the Mathematics score by looking for a score that represents the average of the other three. Candidates Deep and Esha can be immediately ruled out, as their Mathematics scores are higher than their other exam scores. Upon calculating the averages for other candidates, Carl is identified as the one who missed the Mathematics examination.
For Carl: The best 3 out of 4 scores are 80 (Hindi), 90 (Social Science), and 100 (Science).
Average = (80 + 90 + 100) / 3 = 270 / 3 = 90, which matches his reported Mathematics score.
Therefore, Carl missed his Mathematics examination.
Based on Condition III, the student who missed both Hindi and Science exams would have similar average scores in these two subjects. Alva has an identical score of 75 in both Hindi and Science. Similarly, Deep has a score of 90 in both subjects. This means one of them missed Hindi and Science, while the other missed only Hindi.
Since Carl, Alva, and Deep are unlikely to have missed the English exam, we focus on Bithi, Esha, and Foni for the English exam. Bithi’s English score is higher than her other scores, eliminating her as a candidate for missing English.
For Esha: The best 3 out of 4 scores are 85 (Hindi), 95 (Mathematics), and 60 (Science).
Average = (85 + 95 + 60) / 3 = 240 / 3 = 80, which matches her reported English score.
Therefore, Esha most likely missed her English examination.
For Foni: The best 3 out of 4 scores are 78 (Mathematics), 83 (Social Science), and 88 (Science).
Average = (78 + 83 + 88) / 3 = 249 / 3 = 83, which matches her reported English score.
Therefore, Foni most likely missed her English examination.
According to Condition I, exactly two students missed each of the English, Hindi, Science, and Social Science examinations. For English, Esha and Foni were identified. For Hindi, Alva and Deep were identified. For Science, one of Alva or Deep is a candidate. Since Carl, Alva, and Deep are excluded from missing Science or Social Science exams, we examine Bithi, Esha, and Foni. Bithi has similar scores in Science and Social Science. If she missed these exams, her average of the other two (English and Hindi) should match.
For Bithi: Best 2 out of 3 scores are 90 (English) and 80 (Hindi).
Average = (90 + 80) / 2 = 170 / 2 = 85, which matches her reported Science/Social Science score.
Therefore, Bithi likely missed her Science and Social Science examinations.
Foni has similar scores in English and Social Science. Considering the best 2 out of 3 scores, the average for both subjects equals 83. This leads to the conclusion that Bithi and Foni missed their Social Science examination.
The students who missed only one exam are: Carl (Mathematics); Esha (English), and one of Alva or Deep (Hindi).
Out of the six students, the missed subjects for four individuals (excluding Alva and Deep) can be definitively determined:
Mathematics: Carl
English: Esha & Foni
Hindi: Alva & Deep
Science: Bithi & one of Alva and Deep
Social Science: Foni & Bithi
The missed subjects for four students, excluding Alva and Deep, can be conclusively identified. The correct answer is 4.
Q. 29 Instructions
The local office of the APP-CAB company evaluates the performance of five cab drivers, Arun, Barun, Chandan, Damodaran, and Eman for their monthly payment based on ratings in five different parameters (P1 to P5) as given below:
P1: timely arrival
P2: behaviour
P3: comfortable ride
P4: driver’s familiarity with the route
P5: value for money
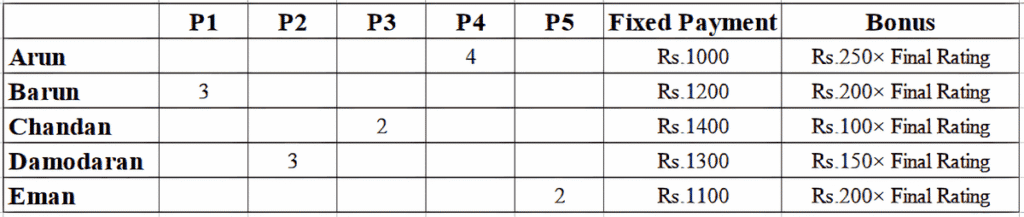
Based on feedback from the customers, the office assigns a rating from 1 to 5 in each of these parameters. Each rating is an integer from a low value of 1 to a high value of 5. The final rating of a driver is the average of his ratings in these five parameters. The monthly payment of the drivers has two parts – a fixed payment and final rating-based bonus. If a driver gets a rating of 1 in any of the parameters, he is not eligible to get bonus. To be eligible for bonus a driver also needs to get a rating of five in at least one of the parameters. The partial information related to the ratings of the drivers in different parameters and the monthly payment structure (in rupees) is given in the table below:
The following additional facts are known.
1. Arun and Barun have got a rating of 5 in exactly one of the parameters. Chandan has got a rating of 5 in exactly two parameters.
2. None of drivers has got the same rating in three parameters.
If Damodaran does not get a bonus, what is the maximum possible value of his final rating?
Check Solution
Ans: C
Considering the provided stipulations, Damodaran forfeits his bonus if he receives a score of 1 in any of the five evaluation criteria. Furthermore, he must achieve a score of 5 in at least one criterion. Consequently, the highest possible sum of ratings he could accumulate would be 1 + 3 + 5 + 5 + 5. However, as per the second condition, he is permitted to have identical scores in no more than two of the parameters. Therefore, the maximum possible average score is calculated as (1 + 3 + 5 + 5 + 4) / 5 = 18/5 = 3.6. Accordingly, Option C represents the correct solution.
Q. 30 If Eman gets a bonus, what is the minimum possible value of his final rating?
Check Solution
Ans: D
As Eman received a bonus, it implies he achieved a score of 5 in a minimum of one assessment area. To determine the lowest possible final score, we consider the following sum of scores: 5 (essential) + 2 (provided) + 2 + 3 + 3 = 15. Consequently, the minimum value for his final rating is 15 divided by 5, which equals 3. Thus, the correct selection is D.
Q. 31 If all five drivers get bonus, what is the minimum possible value of the monthly payment (in rupees) that a driver gets?
Check Solution
Ans: D
The aim is to determine the lowest possible monthly payment, which requires minimizing the final ratings. A rating of 1 in any category is not feasible because all individuals received a bonus, and at least one parameter must have a rating of 5. Considering this, the calculations are as follows:
**Arun**
* Final rating = (5+4+2+2+3)/5 = 16/5 = 3.2
* Fixed payment = Rs. 1000
* Variable payment = 3.2 * Rs. 250 = Rs. 800
* Total payment = Rs. (1000 + 800) = Rs. 1800
**Barun**
* Final rating = (5+3+2+2+3)/5 = 15/5 = 3
* Fixed payment = Rs. 1200
* Variable payment = 3 * Rs. 200 = Rs. 600
* Total payment = Rs. (1200 + 600) = Rs. 1800
**Chandan** (achieved a rating of 5 in exactly two parameters, as per condition 1)
* Final rating = (5+5+2+2+3)/5 = 17/5 = 3.4
* Fixed payment = Rs. 1400
* Variable payment = 3.4 * Rs. 100 = Rs. 340
* Total payment = Rs. (1400 + 340) = Rs. 1740
**Damodaran**
* Final rating = (5+3+2+2+3)/5 = 15/5 = 3
* Fixed payment = Rs. 1300
* Variable payment = 3 * Rs. 150 = Rs. 450
* Total payment = Rs. (1300 + 450) = Rs. 1750
**Eman**
* Final rating = (5+3+2+2+3)/5 = 15/5 = 3
* Fixed payment = Rs. 1100
* Variable payment = 3 * Rs. 200 = Rs. 600
* Total payment = Rs. (1100 + 600) = Rs. 1700
The lowest monthly payment observed is Rs. 1700.
Q. 32 If all five drivers get bonus, what is the maximum possible value of the monthly payment (in rupees) that a driver gets?
Check Solution
Ans: A
Our objective is to achieve the highest possible final ratings to determine the maximum monthly payment. A rating of 1 is not permissible for any parameter since all drives qualified for the bonus, and at least one parameter must have a rating of 5. With this understanding, we calculate the following:
Arun
: {Condition 1 allows for a single rating of 5}
Final rating = (5+4+4+3+3)/5 = 19/5 = 3.8; Base payment = Rs.1000
Performance-based payment = 3.8 * Rs. 250 = Rs.950 ; Total = Rs.(1000+950) = Rs.
1950
Barun
: {Condition 1 allows for a single rating of 5}
Final rating = (5+4+4+3+3)/5 = 19/5 = 3.8; Base payment = Rs.1200
Performance-based payment = 3.8 * Rs. 200 = Rs.760 ; Total = Rs.(1200+760) = Rs.
1960
Chandan
:
Final rating = (5+5+2+4+4)/5 = 20/5 = 4; Base payment = Rs.1400
Performance-based payment = 4 * Rs. 100 = Rs.400 ; Total = Rs.(1400+400) = Rs.
1800
Damodaran
:
Final rating = (5+5+4+4+3)/5 = 21/5 = 4.2; Base payment = Rs.1300
Performance-based payment = 4.2 * Rs. 150 = Rs.630 ; Total = Rs.(1300+630) = Rs.
1930
Eman
:
Final rating = (5+5+2+4+4)/5 = 20/5 = 4; Base payment = Rs.1100
Performance-based payment = 4 * Rs. 200 = Rs.800 ; Total = Rs.(1100+800) = Rs.
1900
Therefore, the highest achievable monthly payment is Rs. 1960. Option A represents the correct choice.
Q. 33 Instructions
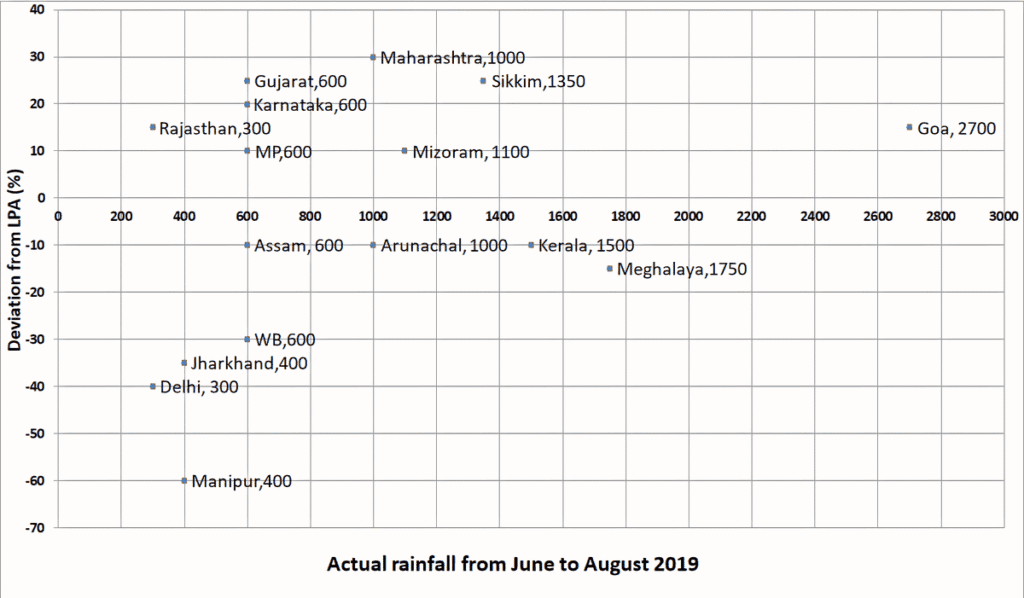
To compare the rainfall data, India Meteorological Department (IMD) calculated the Long Period Average (LPA) of rainfall during period June-August for each of the 16 states. The figure given below shows the actual rainfall (measured in mm) during June-August, 2019 and the percentage deviations from LPA of respective states in 2018. Each state along with its actual rainfall is presented in the figure.
If a ‘Heavy Monsoon State’ is defined as a state with actual rainfall from June-August, 2019 of 900 mm or more, then approximately what percentage of ‘Heavy Monsoon States’ have a negative deviation from respective LPAs in 2019?
Check Solution
Ans: A
The states meeting the specified criteria are: Maharashtra, Mizoram, Sikkim, Goa, Arunachal, Kerala, Meghalaya (total of 7 states).
The “Heavy Monsoon States” exhibit a negative deviation. These states are: Arunachal, Kerala, Meghalaya.
Therefore, the percentage is (3/7) * 100 = 42.86%.
Option A
Q. 34 If a ‘Low Monsoon State’ is defined as a state with actual rainfall from June-August, 2019 of 750 mm or less, then what is the median ‘deviation from LPA’ (as defined in the Y-axis of the figure) of ‘Low Monsoon States’?
Check Solution
Ans: A
The states meeting the criteria for ‘Low monsoon state’ are: Gujarat (+25%), Karnataka (+20%), Rajasthan (+15%), MP (+10%), Assam (-10%), West Bengal (-30%), Jharkhand (-35%), Delhi (-40%), and Manipur (-60%).
The median of all these deviations is -10%, which corresponds to Assam.
Q. 35 What is the average rainfall of all states that have actual rainfall of 600 mm or less in 2019 and have a negative deviation from LPA?
Check Solution
Ans: D
The states of Assam, West Bengal, Jharkhand, Delhi, and Manipur meet the specified criteria.
Their respective rainfall figures in 2019 were 600mm, 600mm, 400mm, 300mm, and 400mm.
The calculated average rainfall for these states is (600 + 600 + 400 + 300 + 400) / 5 = 2300 / 5 = 460mm.
Q. 36 The LPA of a state for a year is defined as the average rainfall in the preceding 10 years considering the period of June-August. For example, LPA in 2018 is the average rainfall during 2009-2018 and LPA in 2019 is the average rainfall during 2010-2019. It is also observed that the actual rainfall in Gujarat in 2019 is 20% more than the rainfall in 2009. The LPA of Gujarat in 2019 is closest to
Check Solution
Ans: C
The rainfall in Gujarat in 2019 exceeded the rainfall in 2009 by 20%.
Let the rainfall in 2009 be represented by ‘x’ mm.
Consequently, the rainfall in 2019 is 1.2x mm.
Given that the rainfall in 2019 was 600mm.
Therefore, the rainfall in 2009 was 500mm.
Since the deviation is +25%, the average rainfall from 2009 to 2018 is calculated as 600 / 1.25 = 480mm.
The LPA for 2019 is computed as (480 * 10 – 500 + 600) / 10 = 490mm.
The correct option is C.
Q. 37 Instructions
There are only four brands of entry level smartphones called Azra, Bysi, Cxqi, and Dipq in a country.
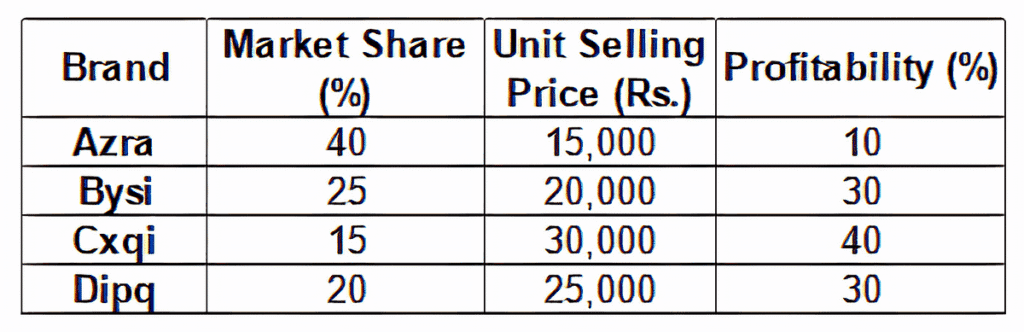
Details about their market share, unit selling price, and profitability (defined as the profit as a percentage of the revenue) for the year 2016 are given in the table below:
In 2017, sales volume of entry level smartphones grew by 40% as compared to that in 2016. Cxqi offered a 40% discount on its unit selling price in 2017, which resulted in a 15% increase in its market share. Each of the other three brands lost 5% market share. However, the profitability of Cxqi came down to half of its value in 2016. The unit selling prices of the other three brands and their profitability values remained the same in 2017 as they were in 2016.
The brand that had the highest revenue in 2016 is:
Check Solution
Ans: C
Let ‘100x’ represent the quantity of smartphones sold in the year 2016.
The total income derived by Azra is calculated as 40x units * Rs. 15,000 per unit = Rs. 600,000x.
The total income derived by Bysi is calculated as 25x units * Rs. 20,000 per unit = Rs. 500,000x.
The total income derived by Cxqi is calculated as 15x units * Rs. 30,000 per unit = Rs. 450,000x.
The total income derived by Dipq is calculated as 20x units * Rs. 25,000 per unit = Rs. 500,000x.
Observing these figures, the income generated by Azra is the largest compared to the other three brands. Therefore, option C is the correct choice.
Q. 38 The brand that had the highest profit in 2016 is:
Check Solution
Ans: C
Let ‘100x’ represent the quantity of smartphones sold in the year 2016.
The total earnings for Azra are calculated as 40x units sold multiplied by Rs. 15,000 per unit, resulting in Rs. 600,000x.
Profitability is determined by profit as a proportion of revenue. Consequently, Azra’s profit is 10% of Rs. 600,000x, which amounts to Rs. 60,000x.
The total earnings for Bysi are calculated as 25x units sold multiplied by Rs. 20,000 per unit, resulting in Rs. 500,000x.
Bysi’s profit is 30% of Rs. 500,000x, which amounts to Rs. 150,000x.
The total earnings for Cxqi are calculated as 15x units sold multiplied by Rs. 30,000 per unit, resulting in Rs. 450,000x.
Cxqi’s profit is 40% of Rs. 450,000x, which amounts to Rs. 180,000x.
The total earnings for Dipq are calculated as 20x units sold multiplied by Rs. 25,000 per unit, resulting in Rs. 500,000x.
Dipq’s profit is 30% of Rs. 500,000x, which amounts to Rs. 150,000x.
Observing these figures, Cxqi exhibits the highest profit among the four brands. Therefore, option C is the correct selection.