
CAT 2024 LRDI Slot 2 Paper
Q. 1 Instructions
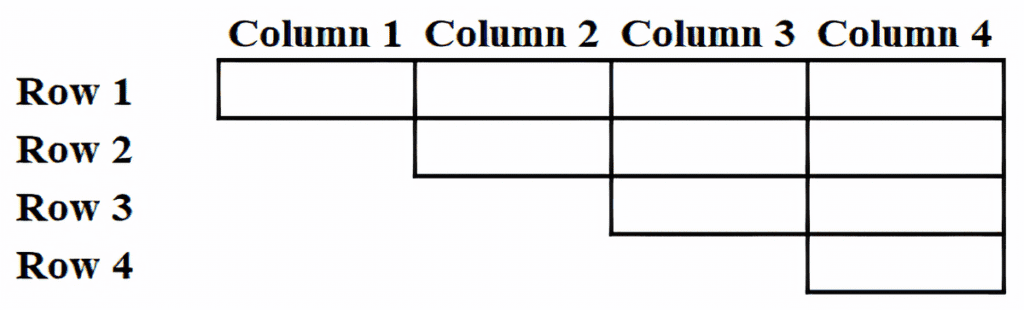
The numbers 1, 2, 3, 4, 5, 6, 7, 8, 9, and 10 are placed in ten slots of the following grid based on the conditions below.
1. Numbers in any row appear in an increasing order from left to right.
2. Numbers in any column appear in a decreasing order from top to bottom.
3. 1 is placed either in the same row or in the same column as 10.
4. Neither 2 nor 3 is placed in the same row or in the same column as 10.
5. Neither 7 nor 8 is placed in the same row or in the same column as 9.
6. 4 and 6 are placed in the same row.
What is the row number which has the least sum of numbers placed in that row?
Check Solution
Ans: 4
To be published
Q. 2 Which of the following statements MUST be true?
I. 10 is placed in a slot in Row 1.
II. 1 is placed in a slot in Row 4.
Check Solution
Ans: A
To be published
Q. 3 Which of the following statements MUST be true?
I. 2 is placed in a slot in Column 2.
II. 3 is placed in a slot in Column 3.
Check Solution
Ans: C
To be published
Q. 4 For how many slots in the grid, placement of numbers CANNOT be determined with certainty?
Check Solution
Ans: 2
To be published
Q. 5 What is the sum of the numbers placed in Column 4?
Check Solution
Ans: 26
To be published
Q. 6 Instructions
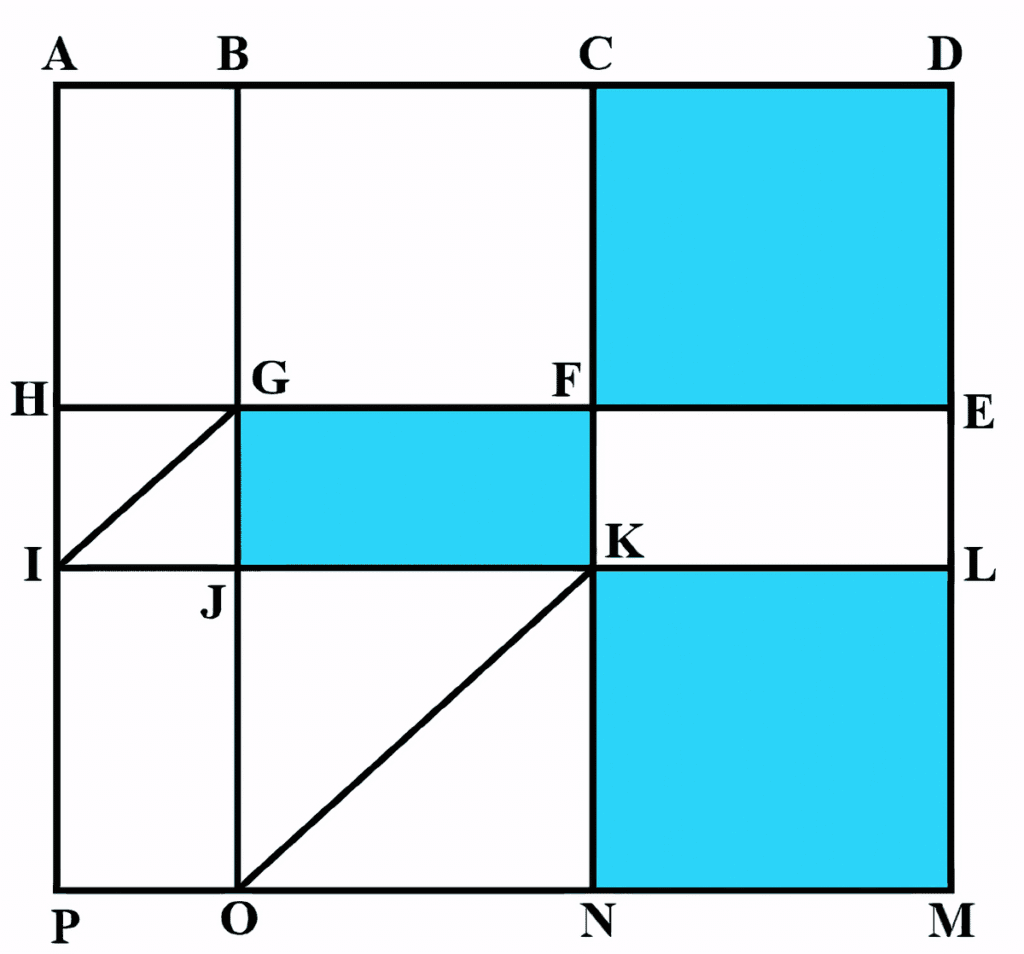
The above is a schematic diagram of walkways (indicated by all the straight-lines) and lakes (3 of them, each in the shape of rectangles – shaded in the diagram) of a gated area. Different points on the walkway are indicated by letters (A through P) with distances being OP = 150 m, ON = MN = 300 m, ML = 400 m, EL = 200 m, DE = 400 m.
The following additional information about the facilities in the area is known.
1. The only entry/exit point is at C.
2. There are many residences within the gated area; all of them are located on the path AH and ML with four of them being at A, H, M, and L.
3. The post office is located at P and the bank is located at B.
One resident whose house is located at L, needs to visit the post office as well as the bank. What is the minimum distance (in m) he has to walk starting from his residence and returning to his residence after visiting both the post office and the bank?
Check Solution
Ans: B
To be published
Q. 7 One person enters the gated area and decides to walk as much as possible before leaving the area without walking along any path more than once and always walking next to one of the lakes. Note that he may cross a point multiple times. How much distance (in m) will he walk within the gated area?
Check Solution
Ans: C
To be published
Q. 8 One resident takes a walk within the gated area starting from A and returning to A without going through any point (other than A) more than once. What is the maximum distance (in m) she can walk in this way?
Check Solution
Ans: 5100
To be published
Q. 9 Visitors coming for morning walks are allowed to enter as long as they do not pass by any of the residences and do not cross any point (except C) more than once. What is the maximum distance (in m) that such a visitor can walk within the gated area?
Check Solution
Ans: 3500
To be published
Q. 10 Instructions
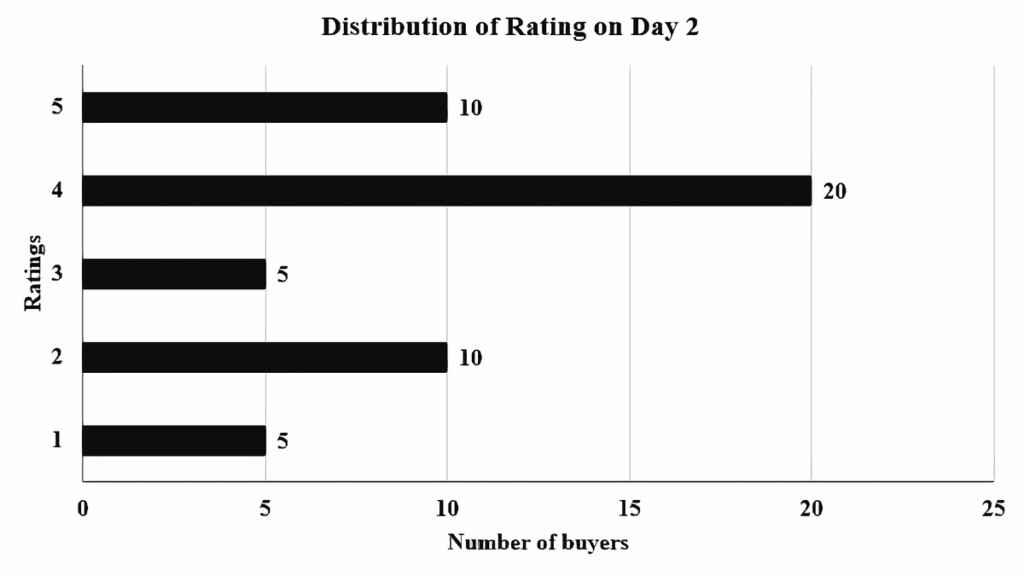
An online e-commerce firm receives daily integer product ratings from 1 through 5 given by buyers. The daily average is the average of the ratings given on that day. The cumulative average is the average of all ratings given on or before that day. The rating system began on Day 1, and the cumulative averages were 3 and 3.1 at the end of Day 1 and Day 2, respectively. The distribution of ratings on Day 2 is given in the figure below.
The following information is known about ratings on Day 3.
1. 100 buyers gave product ratings on Day 3.
2. The modes of the product ratings were 4 and 5.
3. The numbers of buyers giving each product rating are non-zero multiples of 10.
4. The same number of buyers gave product ratings of 1 and 2, and that number is half the number of buyers who gave a rating of 3.
How many buyers gave ratings on Day 1?
Check Solution
Ans: 150
Based on the provided chart, the average rating on day 2 can be calculated as follows:
$\frac{\left(5\times\ 1\right)+\left(10\times\ 2\right)+\left(5\times\ 3\right)+\left(20\times\ 4\right)+\left(10\times\ 5\right)}{5+10+5+20+10}=\frac{170}{50}=3.4$
We are informed that the combined average rating for day 1 and day 2 is 3.1, and the average rating for day 1 alone was 3.
Let’s denote the quantity of ratings received on day 1 as $x$. Using the overall average for both days and the average for day 2, we can establish the following equation:
$\frac{3x+\left(50\times\ 3.4\right)}{x+50}=3.1$
Multiplying both sides by $x+50$ yields:
$3x+170=3.1(x+50)$
$3x+170=3.1x+155$
Rearranging the terms to solve for $x$:
$170 – 155 = 3.1x – 3x$
$15\ =\ 0.1x$
Dividing by 0.1 gives:
$x=150$
Thus, the count of ratings received on day 1 was 150.
Q. 11 What is the daily average rating of Day 3?
Check Solution
Ans: A
On the third day, a total of 100 ratings were recorded.
The most frequent ratings (modes) were 4 and 5, indicating an equal quantity of these ratings. Since all ratings were stated to be non-zero multiples of 10, let this quantity be represented as $10b$.
Let’s assign the count of 1 and 2 ratings as $10a$ for each, and consequently, the count of 3 ratings would be $20a$.
Summing up all the ratings: $10a + 10a + 20a + 10b + 10b = 100$
This simplifies to: $40a + 20b = 100$
Dividing by 20, we get: $2a + b = 5$
The possible integer solutions for $a$ and $b$, where neither is zero, are:
1. $a = 1$ and $b = 3$
2. $a = 2$ and $b = 1$
However, if $b=1$, then the number of 4 and 5 ratings would be 10 each, while the number of 3 ratings would be 20. This would make 3 the sole mode rating, contradicting the given information that both 4 and 5 were modes. Therefore, we must discard the second case ($a=2, b=1$).
This leaves us with the counts:
– 1 rating: $10 \times 1 = 10$
– 2 ratings: $10 \times 1 = 10$
– 3 ratings: $20 \times 1 = 20$
– 4 ratings: $10 \times 3 = 30$
– 5 ratings: $10 \times 3 = 30$
The average rating is calculated as:
$ \frac{(10 \times 1) + (10 \times 2) + (20 \times 3) + (30 \times 4) + (30 \times 5)}{100} $
$ = \frac{10 + 20 + 60 + 120 + 150}{100} $
$ = \frac{360}{100} = 3.6 $
Thus, Option A is the correct selection.
Q. 12 What is the median of all ratings given on Day 3?
Check Solution
Ans: 4
To be published
Q. 13 Which of the following is true about the cumulative average ratings of Day 2 and Day 3?
Check Solution
Ans: C
The aggregate rating by the close of day 3 can be computed as:
$\frac{\left(\text{Day 2 aggregate rating} \times \text{Day 2 rating count}\right)+\left(\text{Day 3 rating} \times \text{Day 3 count}\right)}{\text{Total rating count}}$
[Day 2 aggregate rating = 3.1
Number of ratings by day 2 = 200]
$\frac{\left(3.1\times\ 200\right)+\left(3.6\times\ 100\right)}{200+100} = \frac{360+620}{300} = \frac{980}{300} \approx 3.266$
The percentage change in the aggregate rating from day 2 to day 3 is found by:
$\frac{\text{New aggregate rating} – \text{Old aggregate rating}}{\text{Old aggregate rating}} \times 100$
$\frac{3.266-3.1}{3.1}\times\ 100\approx\ 5.34\%$
This result is consistent with the information presented in choice C.
Consequently, choice C is the accurate selection.
Q. 14 Instructions
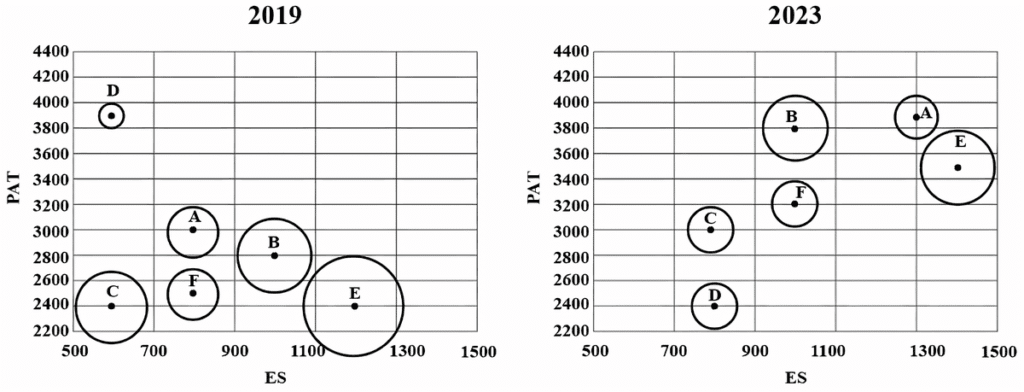
The two plots below give the following information about six firms A, B, C, D, E, and F for 2019 and 2023.
PAT: The firm’s profits after taxes in Rs. crores,
ES: The firm’s employee strength, that is the number of employees in the firm, and
PRD: The percentage of the firm’s PAT that they spend on Research and Development (R&D).
In the plots, the horizontal and vertical coordinates of point representing each firm gives their ES and PAT values respectively. The PRD values of each firm are proportional to the areas around the points representing each firm. The areas are comparable between the two plots, i.e., equal areas in the two plots represent the same PRD values for the two years.
Assume that the annual rate of growth in PAT over the previous year (ARG) remained constant over the years for each of the six firms. Which among the firms A, B, C, and E had the highest ARG?
Check Solution
Ans: C
Given the assumption of a consistent annual expansion rate, we can determine the firms with the highest Average Growth Rate (ARG) by examining the percentage change in their Profit After Tax (PAT) between 2019 and 2023.
Firm A: PAT increased from 3000 to 3900. The absolute increase is 900. The growth rate is calculated as $\frac{900}{3000} = \frac{3}{10} = 0.3$.
Firm C: PAT increased from 2400 to 3000. The absolute increase is 600. The growth rate is calculated as $\frac{600}{2400} = \frac{1}{4} = 0.25$.
Firm E: PAT increased from 2400 to 3500. The absolute increase is 1100. The growth rate is calculated as $\frac{1100}{2400} = \frac{11}{24} \approx 0.45$.
Firm B: PAT increased from 2800 to 3800. The absolute increase is 1000. The growth rate is calculated as $\frac{1000}{2800} = \frac{5}{14} \approx 0.35$.
Comparing these calculated growth rates, Firm E exhibits the highest expansion rate, approaching 0.5. Consequently, Firm E is expected to have the highest ARG among the presented choices.
Therefore, the correct selection is Option C.
Q. 15 The ratio of the amount of money spent by Firm C on R&D in 2019 to that in 2023 is closest to
Check Solution
Ans: D
This question can be somewhat challenging because the bubbles aren’t confined by strict boundaries, but in such situations, we should estimate based on the most apparent representations.
For example, the bubble representing C in 2019 appears to have a vertical diameter of approximately 3 units, whereas the one in 2023 has a diameter of about 2 units.
The proportion of expenditure on R&D in 2019 compared to 2024 can be calculated as follows:
$\frac{2400\pi\left(1.5\right)^2\ }{3000\pi\ \left(1\right)^2}=\frac{8}{10}\times\ \frac{9}{4}=9:5$
This corresponds to option D.
Q. 16 Which among the firms A, C, E, and F had the maximum PAT per employee in 2023?
Check Solution
Ans: D
The profit generated per worker for each company in the year 2023 is calculated as follows:
For Company E:
$\frac{3500}{1400} = \frac{35}{14} = \frac{5}{2}$
For Company A:
$\frac{3900}{1300} = 3$
For Company F:
$\frac{3200}{1000} = 3.2$
For Company C:
$\frac{3000}{800} = \frac{15}{4} = 3.75$
The highest profit per worker is observed for Company C. Consequently, Option D represents the correct selection.
Q. 17 Which among the firms C, D, E, and F had the least amount of R&D spending per employee in 2023?
Check Solution
Ans: B
Having previously determined the Profit After Tax (PAT) per employee for firms F, C, and E, we now compute this metric for firm D: $\frac{2400}{800}=3$.
For firms F, C, and D, the represented area is consistent, meaning PAT per employee is the sole determinant. The values are: F at 3.2, C at 3.75, and D at 3. Based on this, D exhibits the lowest PAT per employee among these three.
Now, let’s compare E and D, introducing a proportionality constant ‘k’.
Firm E has a PAT per employee of 2.5 and a radius of 1.5 units. Its R&D expenditure per employee would be calculated as $\frac{5}{2}k\pi\ \left(\frac{3}{2}\right)^2=k\pi\ \times\ \frac{5\times\ 9}{8}$.
Firm D has a PAT per employee of 3 and a radius of 1 unit. Its R&D expenditure per employee would be $\qquad 3k\pi\ \left(1\right)^2=3k\pi\ $.
It is evident that firm E’s R&D expenditure per employee will be higher. Consequently, firm D demonstrates the lowest R&D spending per employee in 2023.
Thus, Option B represents the correct choice.
Q. 18 Instructions
Eight gymnastics players numbered 1 through 8 underwent a training camp where they were coached by three coaches – Xena, Yuki, and Zara. Each coach trained at least two players. Yuki trained only even numbered players, while Zara trained only odd numbered players. After the camp, the coaches evaluated the players and gave integer ratings to the respective players trained by them on a scale of 1 to 7, with 1 being the lowest rating and 7 the highest.
The following additional information is known.
1. Xena trained more players than Yuki.
2. Player-1 and Player-4 were trained by the same coach, while the coaches who trained Player-2, Player-3 and Player-5 were all different.
3. Player-5 and Player-7 were trained by the same coach and got the same rating. All other players got a unique rating.
4. The average of the ratings of all the players was 4.
5. Player-2 got the highest rating.
6. The average of the ratings of the players trained by Yuki was twice that of the players trained by Xena and two more than that of the players trained by Zara.
7. Player-4’s rating was double of Player-8’s and less than Player-5’s.
What best can be concluded about the number of players coached by Zara?
Check Solution
Ans: B
To be published
Q. 19 What was the rating of Player-7?
Check Solution
Ans: 4
To be published
Q. 20 What was the rating of Player-6?
Check Solution
Ans: 5
To be published
Q. 21 For how many players the ratings can be determined with certainty?
Check Solution
Ans: 6
To be published
Q. 22 Who all were the players trained by Xena?
Check Solution
Ans: B
To be published