CBSE Class 9 Maths Notes: Statistics
**Bar Graphs**
A bar graph is a visual representation of data using rectangular bars. The length of each bar is proportional to the value it represents. Bar graphs are excellent for comparing discrete categories of data.
Definitions:
- Category: The distinct groups or items being compared (e.g., months of the year, types of fruits).
- Frequency/Value: The quantity or measurement associated with each category (represented by the bar height).
- Scale: The numerical values used to measure the height of the bars on the y-axis (vertical axis).
Core Principles:
- Bars can be vertical or horizontal.
- Each bar represents a single category.
- All bars should have the same width.
- The space between bars should be consistent.
- The graph must have a title.
- Axes must be labeled, including units.
Example: Consider a survey of favorite ice cream flavors: Vanilla (20), Chocolate (30), Strawberry (15), and Mint Chocolate Chip (25). A bar graph would clearly show the popularity of each flavor.
**Histograms (Unequal Class Intervals)**
A histogram is a graphical representation of grouped data. Unlike bar graphs, histograms show the frequency of data within specific intervals (class intervals). When class intervals are unequal, we must make adjustments to accurately represent the data.
Definitions:
- Class Interval: A range of values (e.g., 0-10, 10-20, 20-30).
- Class Width: The difference between the upper and lower limits of a class interval.
- Frequency: The number of data points that fall within a specific class interval.
- Class Frequency Density: The frequency divided by the class width. This is used to determine the height of the bars when class intervals are unequal.
Core Principles (Unequal Class Intervals):
- The width of each bar corresponds to the class interval width.
- The *height* of each bar is determined by the class frequency density (Frequency/Class Width).
- The area of each bar is proportional to the frequency.
Formula:
Class Frequency Density = $\frac{Frequency}{Class Width}$
Example: Consider the following grouped data where class intervals are unequal :
Class Intervals: 0-5, 5-10, 10-20, 20-30 Frequencies: 10, 8, 12, 6
First, find class widths: 5, 5, 10, 10
Then calculate frequency densities: 10/5=2, 8/5=1.6, 12/10=1.2, 6/10=0.6
The height of each bar in the histogram would be the respective frequency density.
**Frequency Polygons**
A frequency polygon is a graphical representation of the frequencies of a grouped data set. It is created by joining the midpoints of the tops of the bars in a histogram, or by plotting the midpoints of the class intervals and their corresponding frequencies.
Definitions:
- Midpoint: The middle value of a class interval ( (Upper limit + Lower limit)/2 ).
- Frequency: The number of data points that fall within a class interval.
Core Principles:
- Start and end the polygon on the x-axis, at the midpoints of hypothetical intervals with zero frequency before and after the data.
- Plot points using the midpoints of the class intervals on the x-axis and their corresponding frequencies on the y-axis.
- Connect the points with straight lines.
How to Create a Frequency Polygon:
- Find the midpoint of each class interval.
- Determine the frequency for each class interval.
- Plot the midpoint and frequency as a point on the graph.
- Connect the points with straight lines.
- Include an extra class interval before the first and after the last with a frequency of zero to close the polygon on the x-axis.
Example: Given the data: Class Intervals: 10-20, 20-30, 30-40, 40-50 Frequencies: 5, 10, 8, 2
Midpoints: 15, 25, 35, 45
We would plot points (15, 5), (25, 10), (35, 8), and (45, 2). Then, we would add points at (5, 0) and (55, 0) and connect the points with lines.
Further Reading
- Data Collection: Primary & Secondary Data
- Presentation of Data: Frequency Distributions
- Graphical Representation of Data
- Measures of Central Tendency for Ungrouped Data
Practice Statistics Extra Questions
Refer Statistics NCERT Solutions
Refer Class 9 Math Notes & CBSE Syllabus
Conquer Maths & Science – with LearnTheta’s AI-Practice!
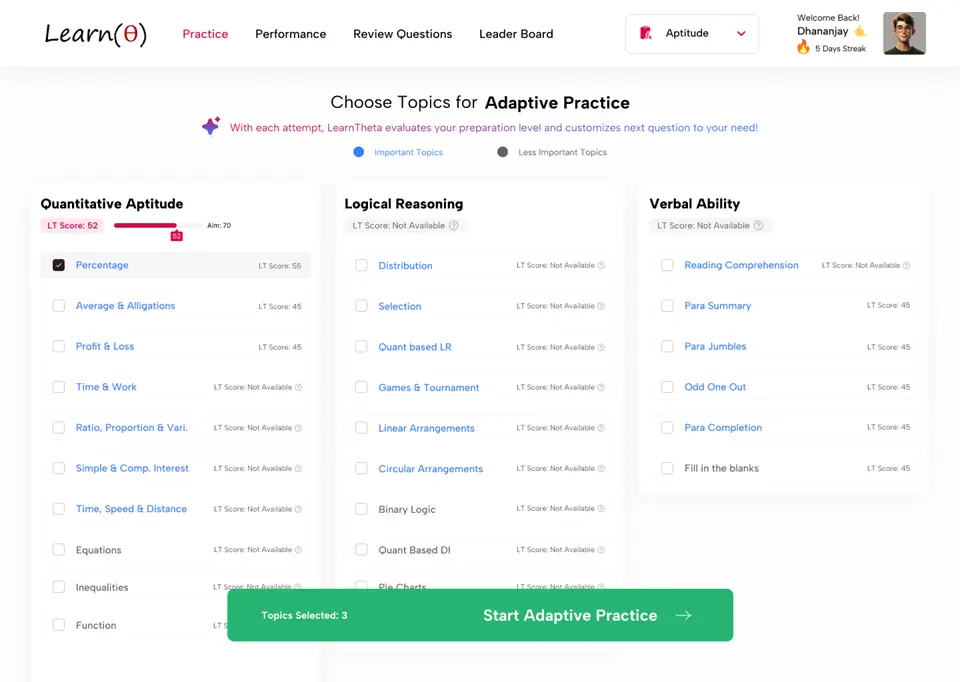
✅ All Topics at One Place
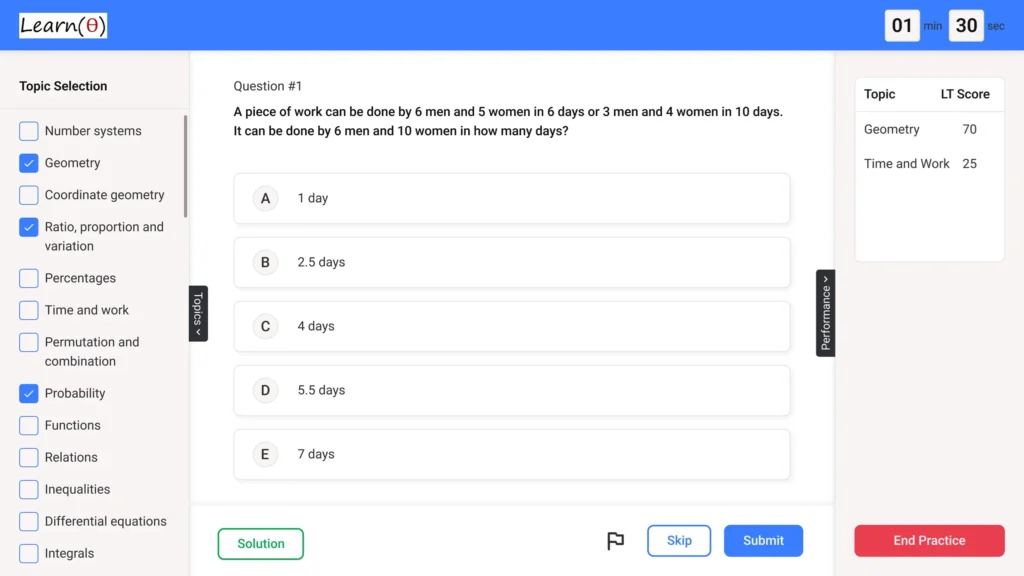
🤖 Adaptive Question Practice
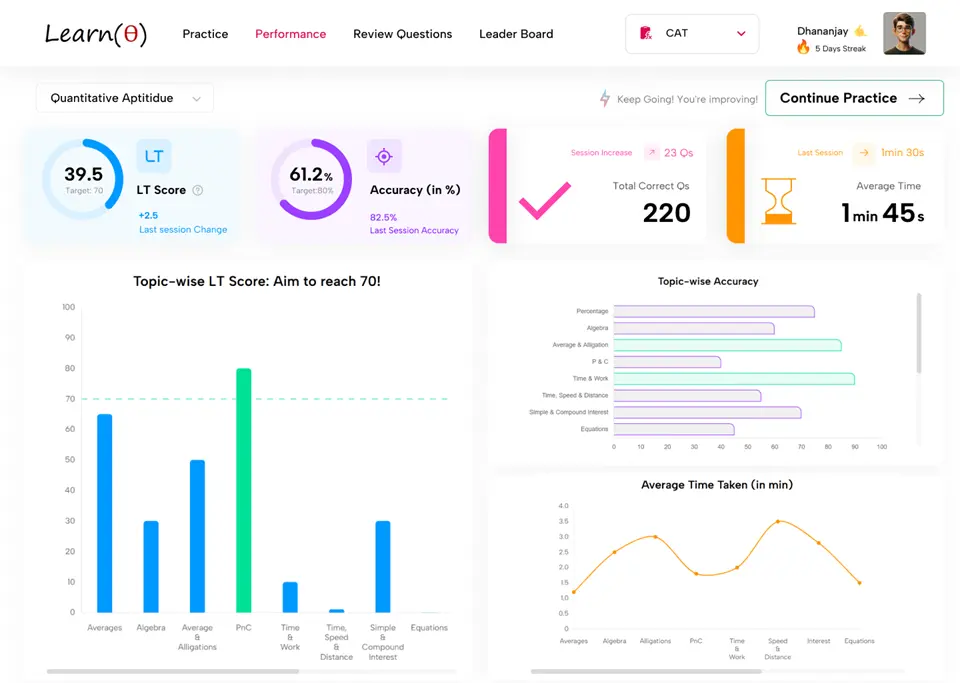
📊 Progress and Insights